Authors: Karthik Guruvayurappan, Michael Nodini, Maddie LaScola, Andrew Li
Introduction
GWAS
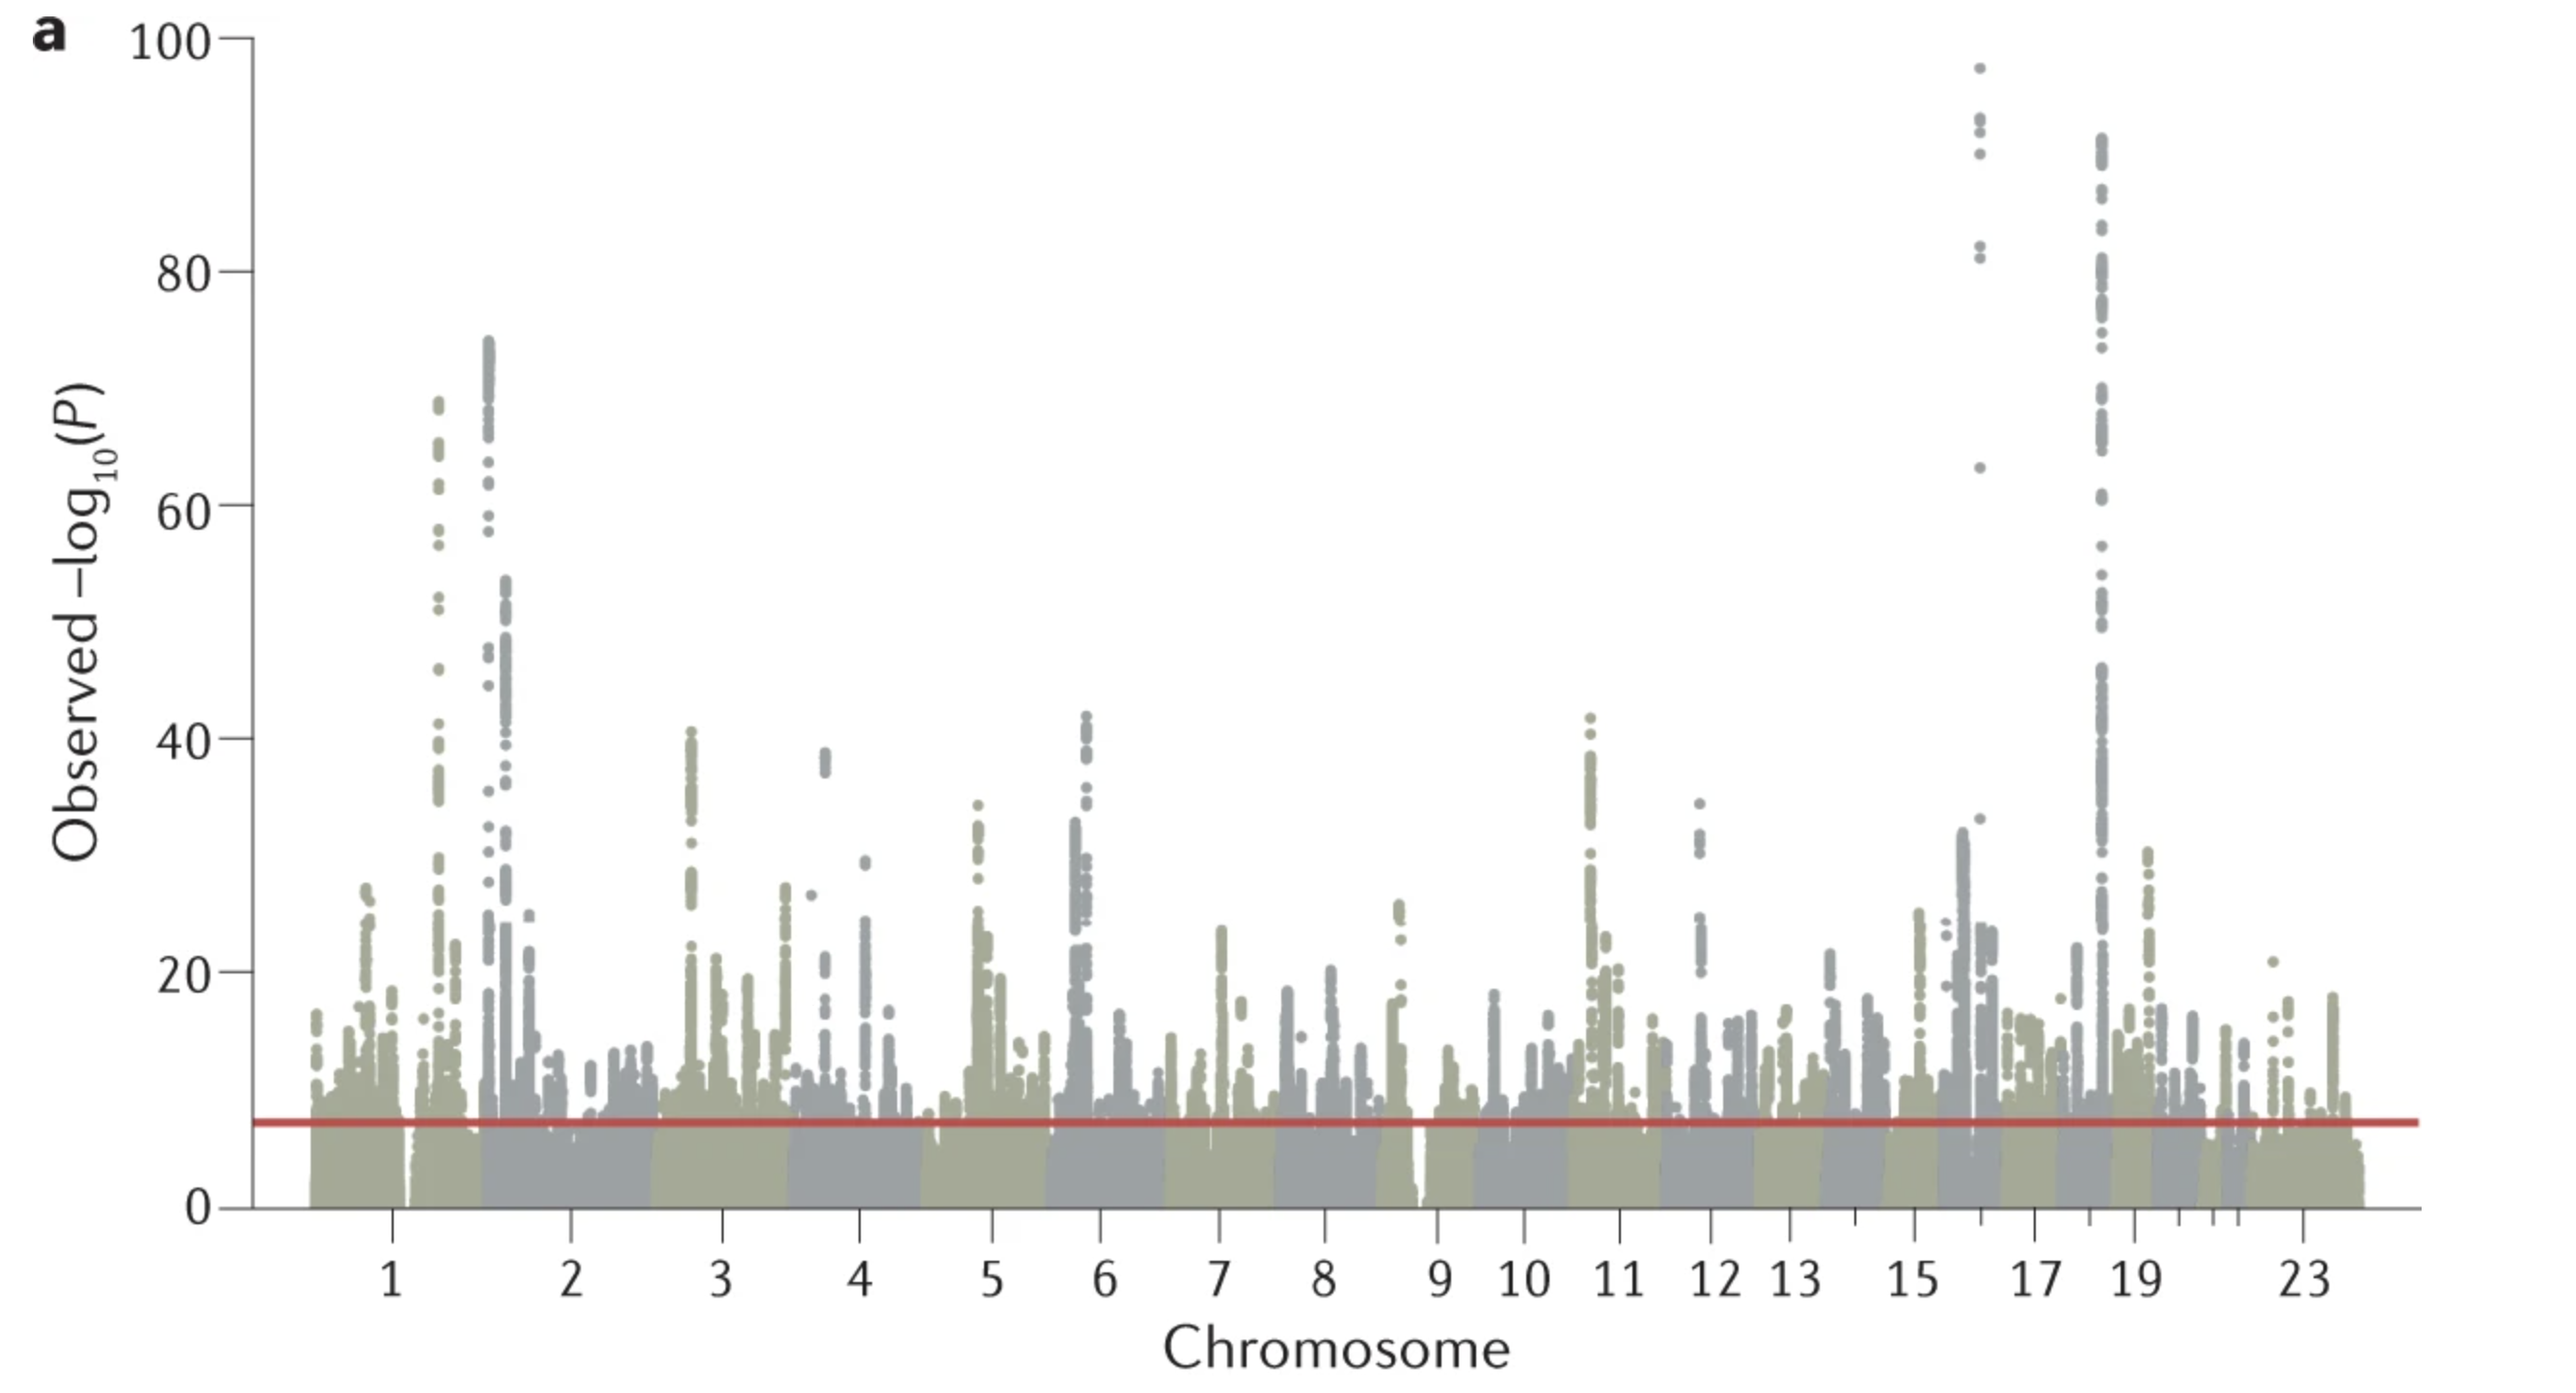
A genome-wide association study takes all of the letters, or nucleotides, in our genome, and associates having a certain nucleotide with a phenotype like height! It’s the equivalent of using the letters in your genome as the x variable, and some human phenotype as the y variable! An example GWAS plot from Uffelman et al. (2021) is shown below:
Genetic Diseases
Variations in our genome, or genetic code, can have large implications on phenotypes, ranging from obesity to autoimmune disease. Therefore, studies like GWAS can be really insightful into understanding how our genome contributes to our traits, This can have really important implications for understanding disease risk, prevention, and treatment.
eQTL - Expression Quantitative Trait Loci
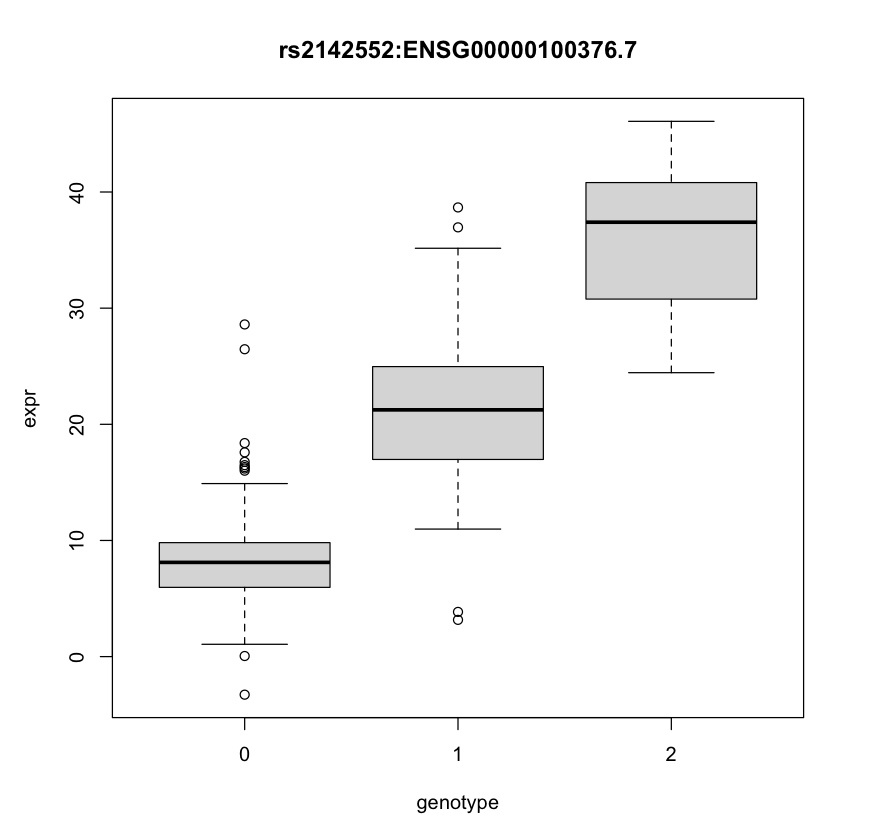
An expression quantitative trait locus (eQTL) is a genetic variant that is significantly associated with gene expression. Usually, linear regression is used to identify these eQTLs. However, they are confounded by this phenomenon called linkage disequilibrium (LD), which makes it such that nearby genetic variants are more likely to be inherited together, and therefore not inherited independently. Therefore, further analysis methods like fine-mapping are used to improve these results using statistics. An example eQTL is shown below:
What did we do?
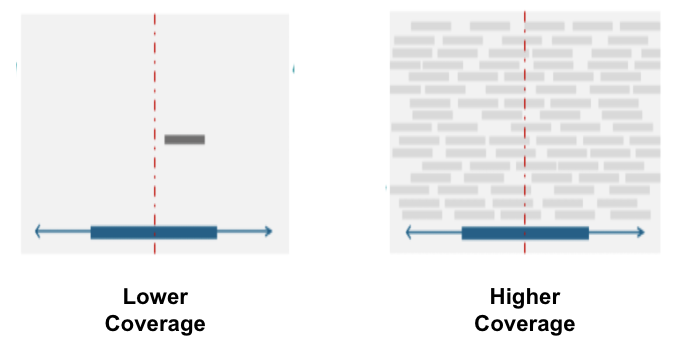
We looked at an experimental parameter called coverage, which is the number of times a nucleotide is sequenced on average in an experiment. We did eQTL mapping and fine-mapping on low and high coverage datasets from the 1000 Genomes Project with the hope of seeing some differences. We hope this framework can inform future experimental designs by comparing the benefits of increased coverage with the costs! A figure explaining coverage is shown below:
Results
This section contains figures we’ve produced highlighting differences between the 2 analyses: higher/lower coverage.
Figure 1
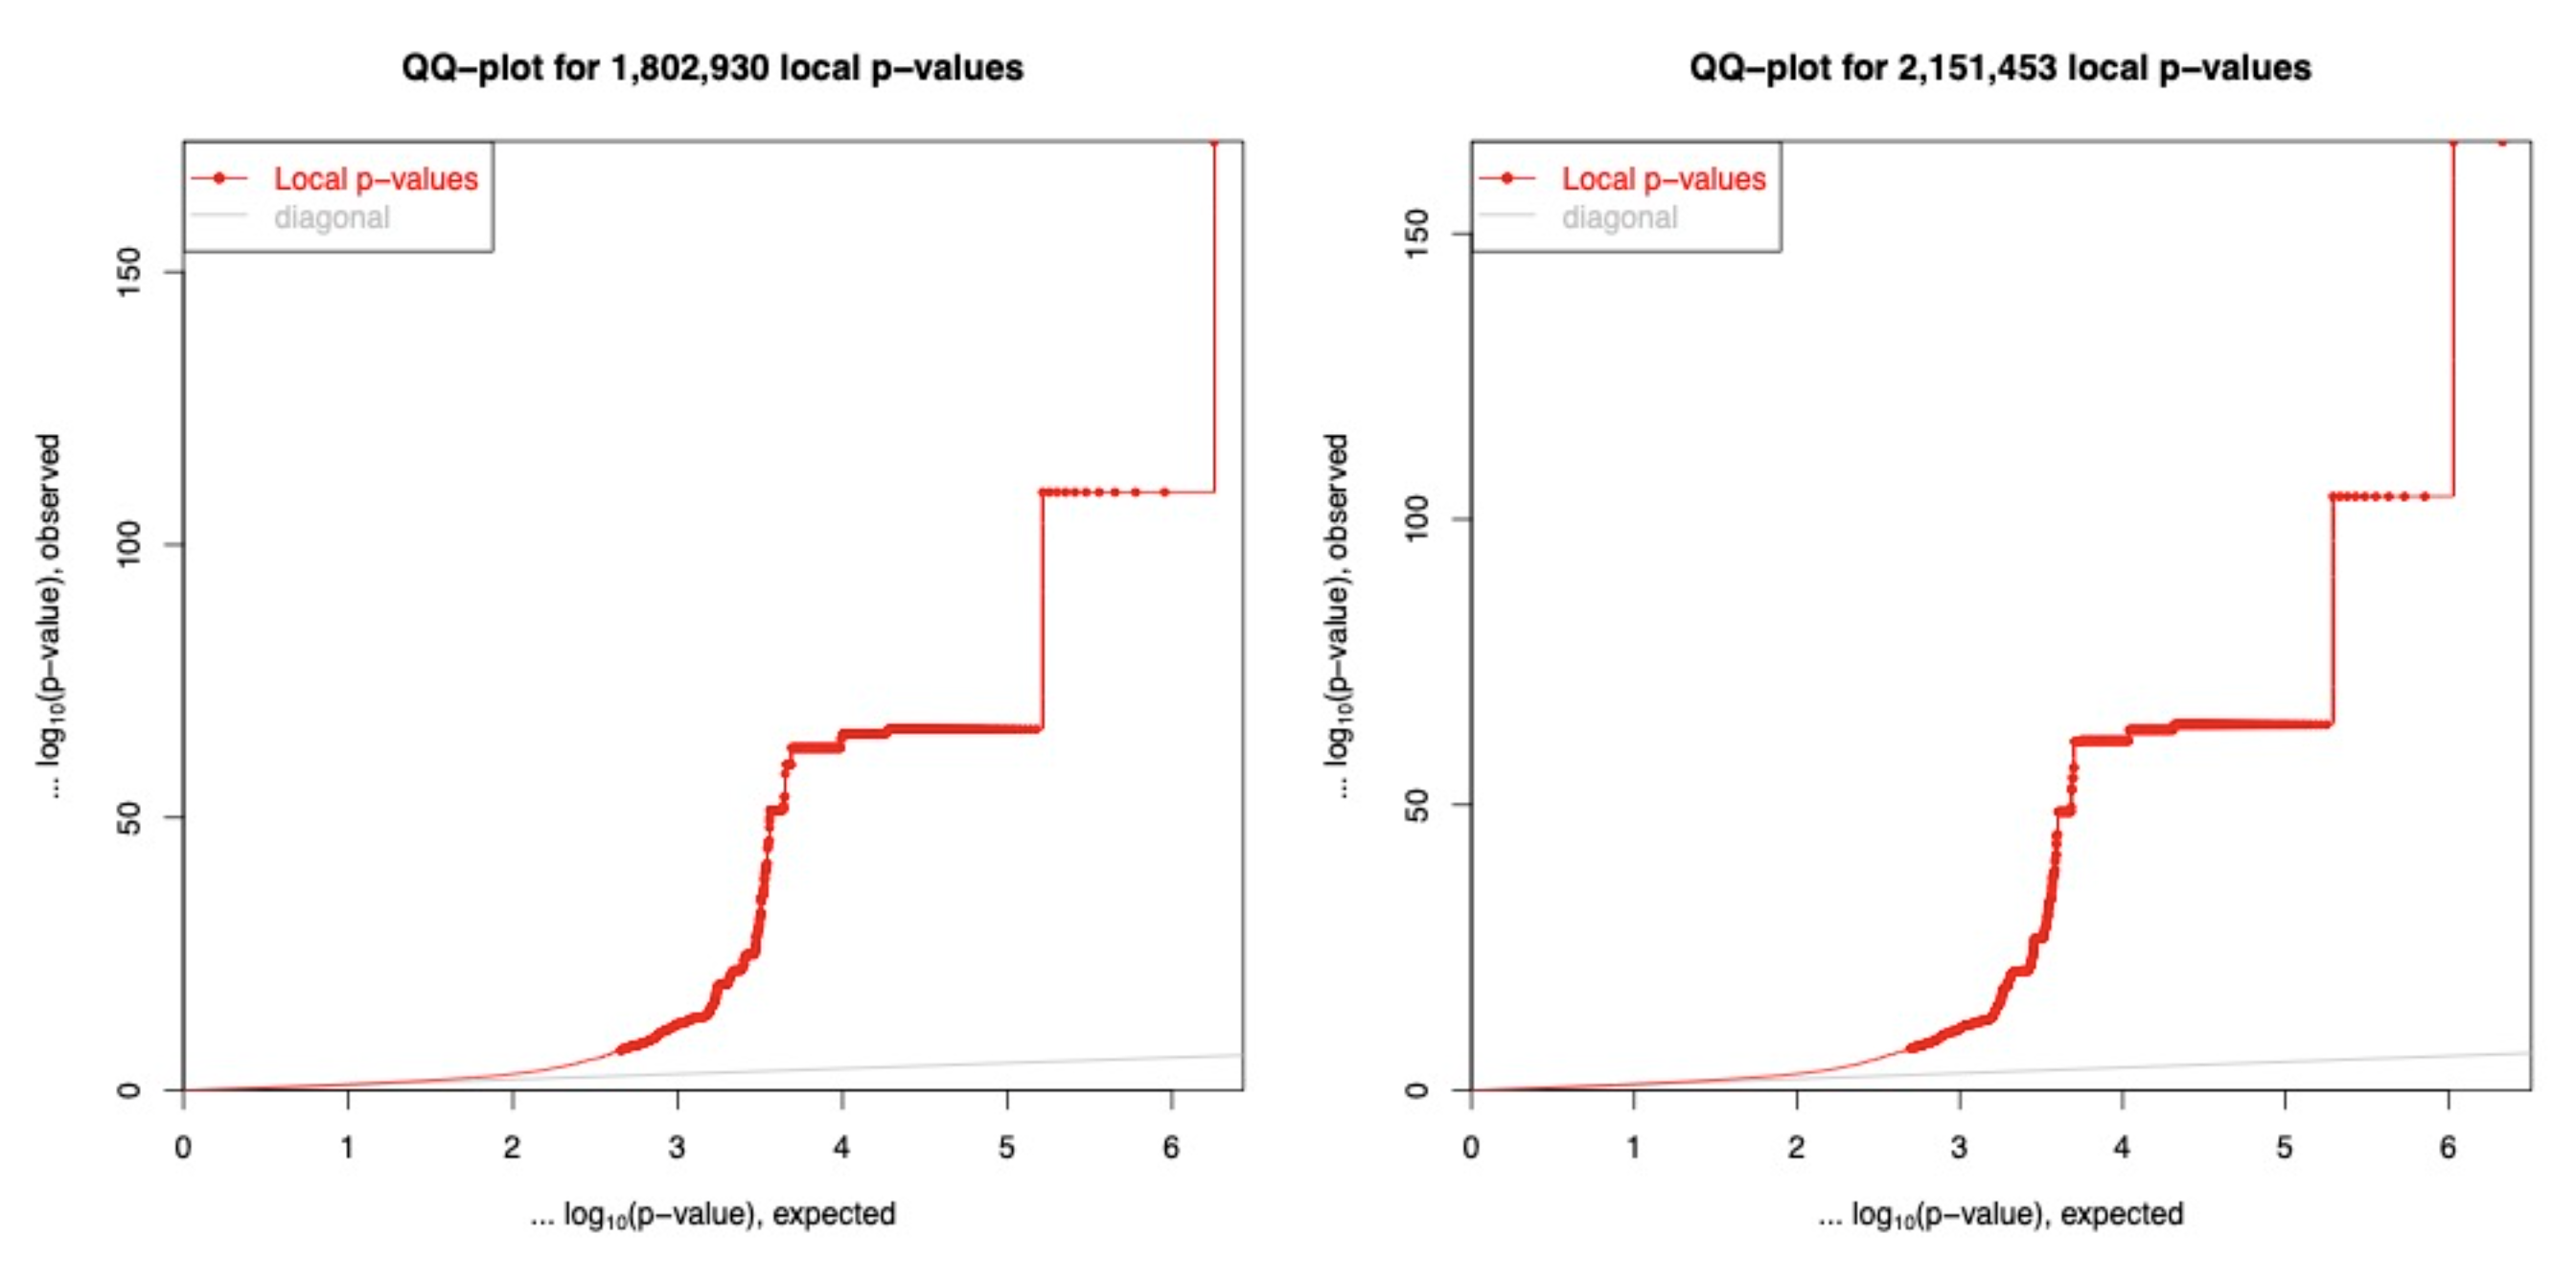
QQ-plots of eQTLs on Chromosome 22 for low coverage and high coverage genotyping. The low coverage (left) had a total of 1,802,930 association tests to identify 4,035 significant cis-eQTLs, while the high coverage had 2,151,453 association tests to identify 4,321 significant cis-eQTLs. (p-value < 5e-8)
Figure 2
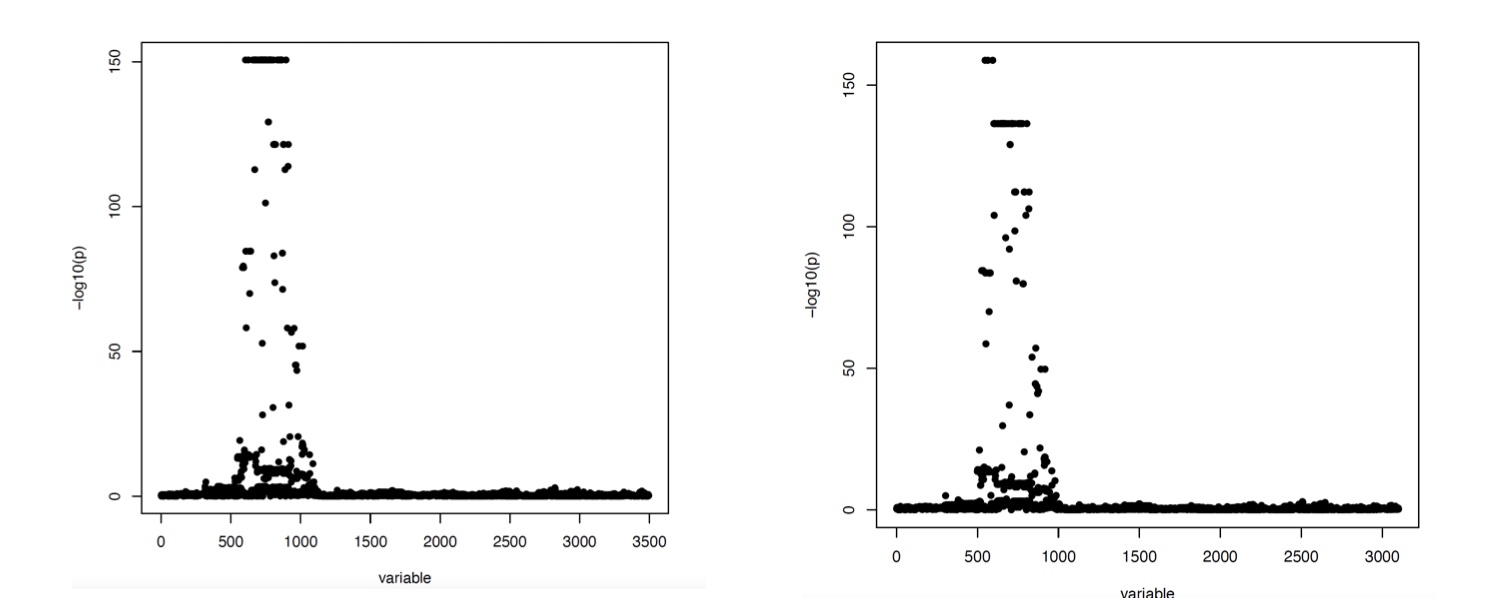
P-value plots for association tests between SNPs proximal to the FAM118A gene and FAM118A RNA-seq expression. The lower coverage is on the right and the higher coverage is on the left.
Figure 3
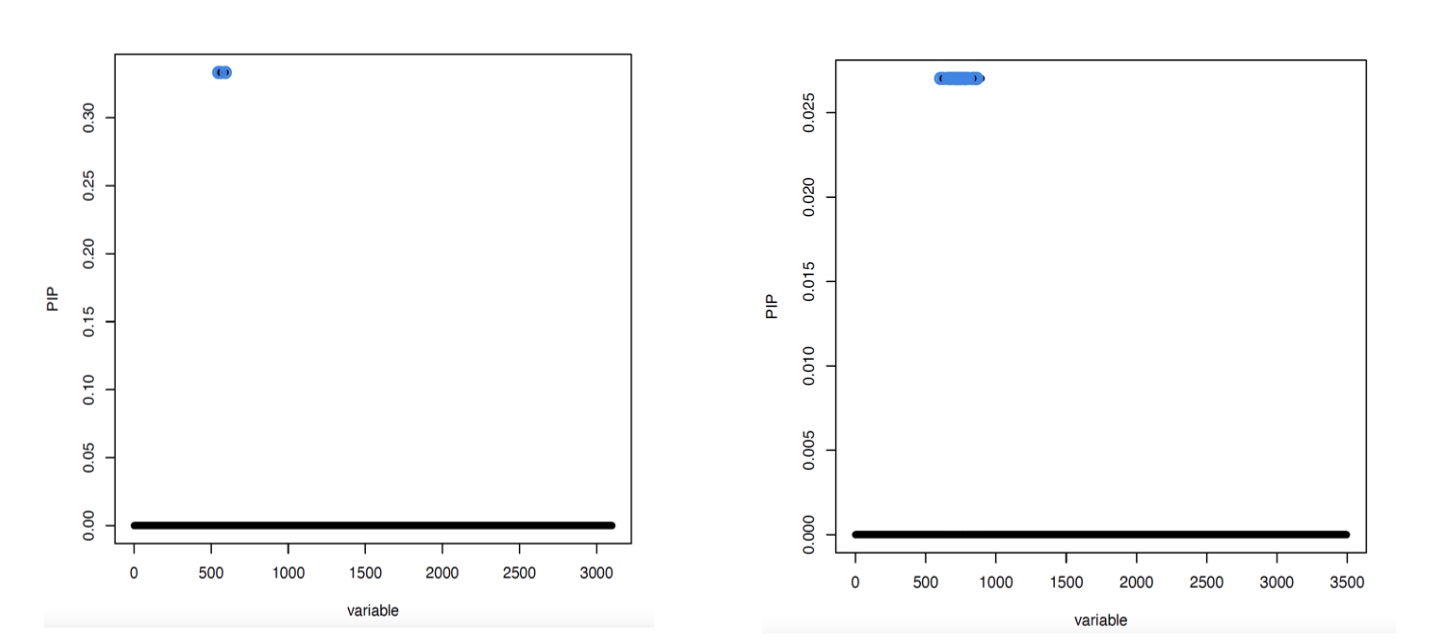
Fine-mapped posterior inclusion probabilities for SNPs proximal to the FAM118A gene and FAM118A gene expression. Blue dots indicate 95% credible sets for potential causal SNPs. There were 3 candidate SNPs in the low coverage data (right), and 35 candidate SNPs in the high coverage data (left).
Methods
At a high level, we obtained genetic variant and gene expression information from the 1000 Genomes Project, and we associated genetic variants with gene expression using Matrix eQTL. Using these eQTLs that we called, we fine-mapped them (find the statistically more likely to be causal ones) using the susieR package. Some more details are below:
- We obtained our datasets from the 1000 Genomes Project aligned to GRCh38 and the Gene Expression aligned to GRCh37! (https://www.internationalgenome.org/data)
- We processed variant call files using the plink package (https://www.cog-genomics.org/plink/1.9/)
- We converted gene annotations using the UCSC LiftOver tool (http://genome.ucsc.edu)
- We called cis-eQTLs within 500 kilobases of a gene with a p-value threshold of 5e-8 using the matrix eQTL package which implements linear regression
- eQTL Regression Equation: Y = XB + e
- We statistically fine-mapped our eQTLs using the iterative Bayesian Stepwise Selection Approach implemented in susieR.
Conclusions
- Higher coverage sequencing data for genotyping identifies a greater number of eQTLs
- When finemapping eQTLs, higher coverage sequencing data identifies a larger number of potential causal SNPs (overlap with GTEx whole blood eQTLs)
- Results are potentially confounded by population structure (leading to multiple SNPs with same p-value!)
References
- Lappalainen, Nature (2013)
- Pritchard, American Journal of Human Genetics (2001)
- Hormozdiari, Genetics (2014)
- Amariuta, American Journal of Human Genetics (2019)
- Buenrostro, Current Protocols in Molecular Biology (2015)
- Subramanian, Proceedings of the National Academy of Sciences (2005)
- Byrska-Bishop, Cell (2022)
- Purcell, American Journal of Human Genetics (2007)
- Shabalin, Bioinformatics (2012)
- Kundaje, Nature (2015)
- Wang, Journal of the Royal Statistical Society (2020)
- Kent, Genome Res (2002)
- Uffelmann, Nat Rev Methods Primers (2021)
- Kato, Nat Rev Methods Primers (2018)
- Robinson, npj Genomic Med (2016)
- Stegle, Nat Protoc (2012)
GitHub
All the code for this project can be found on https://github.com/somet3000/1kgp-coverage-analysis